
On Asylum Seekers and Immigration
Your questions answered. Or perhaps not? It depends on whether you think rationally or simply believe anything you're told on social media.
UK Asylum: A Comprehensive Factual Overview
A research paper addressing fourteen key questions about asylum, immigration, and public perception
Q1: Are There 'Safe and Legal' Routes for Asylum Seekers Who Want to Migrate to the UK?
Yes — but only in a narrow, qualified sense.
The UK operates several distinct safe and legal humanitarian routes. These fall into four categories:
Ukraine Schemes (introduced March 2022): The largest humanitarian programme in recent UK history — 282,687 visas issued by end of 2025. Includes the Homes for Ukrainians sponsorship scheme and the Ukraine Permission Extension scheme. However, these apply only to Ukrainian nationals and their immediate family members. Approximately 102,100 (44%) have since left the UK.
British National (Overseas) Route — Hong Kong (introduced January 2021): Available to BN(O) status holders — a category of British national created for Hong Kong residents before the 1997 handover. Has resettled 185,507 people. Crucially, these are not refugees; they are a specific class of British national with pre-existing ties to the UK.
Refugee Resettlement Schemes: These are the routes most analogous to conventional "safe and legal routes" for people fleeing persecution:
- UK Resettlement Scheme (UKRS) — operated with UNHCR, resettles vulnerable refugees identified abroad. Approximately 4,293 people since 2021.
- Afghan Resettlement Programme (ARP) — the UK's largest emergency resettlement effort. Now closed to new applicants. Approximately 37,950 people resettled since 2021.
- Mandate Scheme — for refugees with a personal connection to the UK, via UNHCR.
- Community Sponsorship — allows charities and community groups to sponsor refugee families.
Overall, the UK resettled 6,417 refugees in the year ending December 2025 — a 19% decrease on the previous year. The great majority (92%) were Afghan nationals.
Refugee Family Reunion: Allows partners and dependent children of those already granted refugee status in the UK to join them. It is not available to those whose claims are still pending, and parents, adult children, siblings, and extended family are excluded entirely. As of September 2025, this route has been suspended by the UK government.
Q2: Why Not?
The question answers itself when you look at the numbers. The UK resettles roughly 6,000 refugees per year through its humanitarian routes. UNHCR estimates 117 million people are currently forcibly displaced globally. The gap between those two figures is not a gap — it is a chasm.
The routes that exist are narrow in four distinct ways:
Narrow by nationality: Ukraine and Hong Kong schemes apply only to Ukrainian and Hong Kong nationals respectively. They are not general humanitarian routes.
Narrow by relationship: Family reunion requires an already-granted refugee in the UK. A person who has not yet claimed asylum — or whose claim is pending — cannot use this route.
Narrow by employment or political connection: The Afghan Resettlement Programme was largely restricted to those who had worked for or supported UK forces or government in Afghanistan. Most Afghan civilians — including women, human rights workers, journalists, and minority group members — did not qualify, and the scheme is now closed to new applicants.
Narrow by geography: Resettlement schemes require UNHCR referral from a specific country of first asylum, typically in the Middle East or North Africa. A person fleeing persecution in Eritrea, Sudan, or Iran who has not yet reached a UNHCR processing camp has no pathway.
As the All-Party Parliamentary Group on Refugees stated in 2025: "The current safe and legal routes are not adequate to address the scale of global displacement."
Q3: Why Do Asylum Seekers Come to the UK Rather Than Germany, France, or Greece?
This is one of the most consistently misrepresented questions in British political life. The framing implies that asylum seekers have a wide menu of safe, viable options and inexplicably choose the UK over obviously preferable alternatives. The reality is very different.
Language and cultural ties are the most commonly cited reason in qualitative research. Many asylum seekers have some English — often from colonial-era education systems — and these pre-existing connections give the UK a particular draw for populations from South Asia, West Africa, and the Caribbean. The UK also has established diaspora communities, meaning newly arrived asylum seekers are more likely to find existing support networks.
Historical and legal links also matter. Many of the top nationalities arriving in the UK — Pakistanis, Bangladeshis, Indians, Nigerians — come from countries with significant historical ties to the UK. Many have family members already in the UK with leave to remain.
The idea that Germany or France is obviously preferable is itself questionable. France has been repeatedly criticised for its treatment of asylum seekers, with reports of police violence against migrants in Calais, systematic pushbacks, and inadequate reception conditions. Germany, despite its large asylum system, has its own well-documented problems with right-wing extremist violence against asylum accommodation centres.
The Channel crossing is not the primary route. Migration Observatory data for 2025 shows that 39% of asylum applicants entered the UK on a valid visa first — work, study, or visitor — and claimed asylum after arrival. The notion that every asylum seeker made a deliberate calculation to cross the Channel is simply wrong.
Q4: How Do Asylum Seeker Numbers in These Countries Compare?
The UK does not have uniquely high asylum numbers. Per capita, it receives fewer asylum seekers than several European countries.
EU first-time asylum applications in 2024 (Eurostat data):
- Germany: 229,700 (25% of all EU applications)
- Spain: 164,000 (18%)
- Italy: 151,100 (17%)
- France: 130,900 (14%)
- Greece: 69,000 (8%)
- UK: approximately 101,000 in 2025 (the UK's own figure)
The UK, with a population of approximately 67 million, is processing fewer asylum applications than Germany (84 million) or France (68 million) — and far fewer per capita than Cyprus (7.2 per 1,000 population) or Greece (6.6 per 1,000). The UK's per-capita rate is well below the EU average of 2.0 per 1,000.
The UK's total immigration figures are dominated by work and study visas, not asylum. Of total immigration in the year ending June 2025, only about 14% was for asylum — six times fewer than the public's average estimate of 33%.
Q5: Why Do They Come by Small Boats?
Because there is no other viable option for most of them.
The available safe and legal routes — as established in Q1–Q2 — exclude the vast majority of people who need protection. UNHCR resettlement places the UK at around 6,000 per year. The family reunion route is suspended. Work and study visas are not asylum routes.
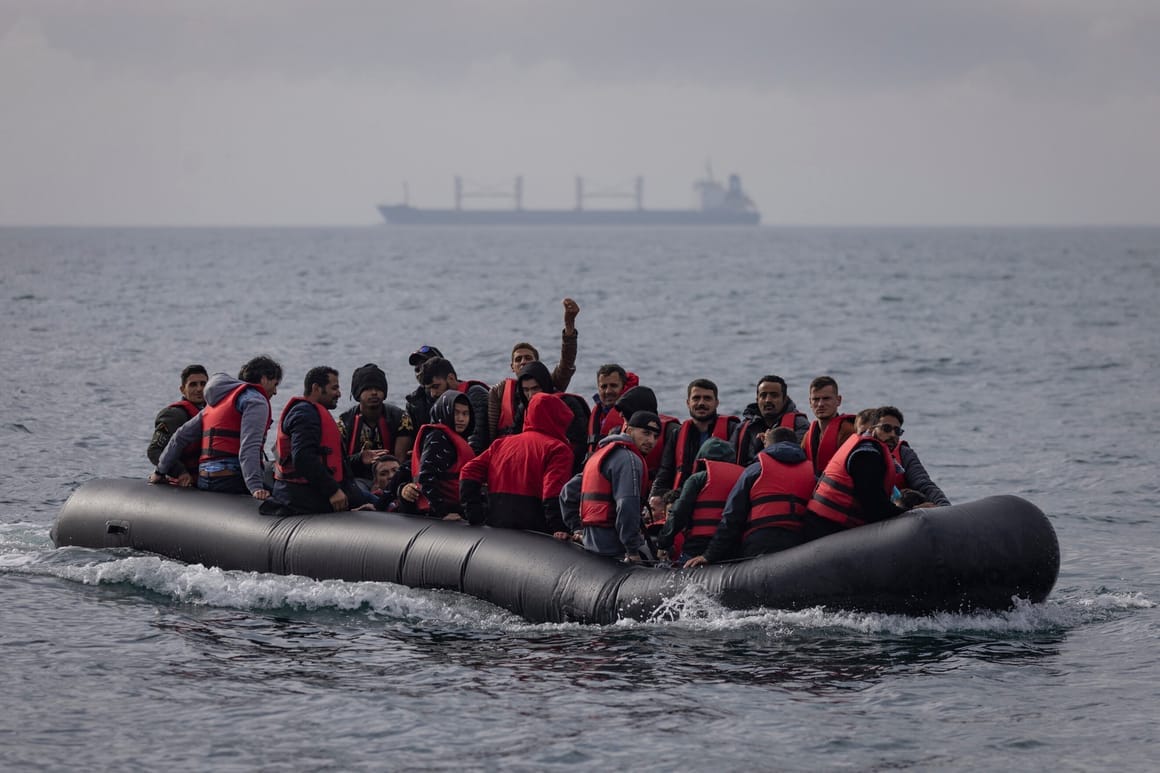
The decision to cross the Channel in a small boat is made after those alternatives have been exhausted or ruled out. It is a last resort, not a first choice.
The crossings are dangerous. Between 2018 and April 2025, 147 people died attempting to cross the Channel in small boats. This is a direct consequence of the absence of safe alternatives.
The criminal justice approach — "smash the gangs" — has been pursued by both Conservative and Labour governments and has consistently failed to stop crossings. Smugglers adapt routes, methods, and pricing in response to enforcement, often making journeys more dangerous in the process. There is no empirical evidence that enforcement has reduced small boat crossings; there is strong evidence that the underlying drivers — conflict, persecution, and the absence of safe routes — continue to produce them.
Q6: Is Coming Here by Small Boat Illegal?
This is one of the most deliberately confused questions in British politics. The honest answer is: it depends on the legal framework you apply — and the framing is politically motivated.
Under international law (the 1951 UN Refugee Convention): No. Article 31 of the 1951 Refugee Convention explicitly states that refugees must not be penalised on account of their illegal entry or presence, if they are coming directly from a territory where their life or freedom was threatened. The UN Refugee Convention is clear that how a person arrives to seek asylum is not a valid criterion for refusing their claim.
Under UK domestic law (Immigration Act 1971): Yes, in a narrow sense. Entering the UK without leave — including across the Channel without authorisation — is a criminal offence. The Nationality and Borders Act 2022 and the Illegal Migration Act 2023 have compounded this, making it increasingly difficult for irregular arrivals to have their asylum claims heard at all.
The political framing: Successive UK governments have deliberately conflated "irregular entry" with "illegal immigration" in public discourse, despite the legal distinction. The language of illegality applied to asylum seekers is a policy choice, not a legal necessity. Most other signatory states to the Refugee Convention manage this distinction more carefully.
The test of legitimacy: 68% of small boat arrivals are ultimately granted asylum or humanitarian protection. If the people making the crossing were, in the main, bogus economic migrants exploiting a loophole, that figure would not exist.
Q7: How Have Immigration Numbers in General Changed Over the Past Ten Years?
Net migration to the UK has followed a dramatic arc over the past decade.
Net migration trajectory (ONS provisional data):
- 2015: ~330,000
- 2016 (post-Brexit referendum): ~250,000 — sharp fall
- 2017–2019: stabilised around 230,000–260,000
- 2020 (COVID): ~90,000 — sharp fall
- 2021: ~175,000 — partial recovery
- 2022: ~606,000 — rapid rise
- Year ending June 2023: ~906,000 — peak, driven by post-COVID recovery, Ukraine schemes, Hong Kong BN(O) route, and asylum
- 2024: ~345,000 — dramatic fall
- Year ending December 2025: ~204,000 — lowest non-COVID level since 2012
The trajectory is striking: net migration has fallen by more than three-quarters from its 2023 peak, and is now at roughly the level it was a decade ago. This is the most significant downward shift in UK immigration in a generation.
The fall is driven primarily by the decline in post-COVID exceptional flows — the Ukraine and Hong Kong schemes are running down, and the peak of humanitarian arrivals has passed. The government attributes some of this to its own policy changes.
Q8: How Have Asylum Seeker Numbers Changed Over the Past Ten Years?
Asylum applications to the UK (main applicants and dependants):
- 2015: ~32,000
- 2016–2017: ~27,000–30,000
- 2018–2019: ~44,000–45,000 (driven by conflicts in Middle East and Horn of Africa)
- 2020 (COVID): ~30,000 — decline
- 2021: ~37,000
- 2022: ~74,000 — sharp rise
- 2023: ~103,000 — record high
- 2024: ~108,000
- 2025: ~101,000 — still historically high by UK standards, but grant rates have fallen
The 2022–2023 surge was driven by the fall of Afghanistan (August 2021), the war in Ukraine (early 2022), and ongoing conflicts in the Horn of Africa and South Asia. This was not unique to the UK — Germany, France, and Spain all saw similar surges in the same period.
The UK grant rate at initial decision has declined significantly: from a peak of 76% in 2022 to 42% in 2025. This is partly due to the Nationality and Borders Act 2022 raising the standard of proof required, and partly due to changing nationality mixes in applications.
Q9: Where Do Asylum Seekers Mostly Come From? (Top Five Nations)
Top five countries of origin for asylum claims, 2025 (Home Office / Migration Observatory data):
- Pakistan — the largest country of origin in 2025. However, grant rates are low (~33% at initial decision, ~4% overall for 2020–2024). Drivers are mixed: economic pressures alongside reports of political persecution.
- Bangladesh — grant rates similarly low (~15%). Like Pakistan, driven by a combination of economic factors and political conditions.
- Eritrea — one of the world's most repressive states. Indefinite national service, torture, extrajudicial detention. Grant rate at initial decision: 87%. Overall grant rate (2020–2024): 94% after appeal.
- Sudan — country in catastrophic civil war since April 2023, with widespread reports of ethnic cleansing. Grant rate at initial decision: 94%. Overall grant rate: 99% after appeal.
- Iran — religious minorities, dissidents, women resisting compulsory hijab laws, LGBTQ+ people. Grant rate has declined but remains significant.
It is worth noting that for Pakistan and Bangladesh — the two largest sources of applications by volume — the grant rates are low, suggesting many applicants may be motivated partly by economic factors. For Eritrea and Sudan — smaller numbers but higher desperation — the grant rates are near-absolute, telling a very different story.
Q10: What Is the Gender and Age Breakdown of Asylum Seekers?
Gender: Asylum applications are roughly split between men and women, but men are significantly more likely to arrive as single adults via irregular routes.
- At initial decision in 2025, grant rates were broadly similar for men (41%) and women (45%), though differences were more pronounced among younger and older age groups.
- Among 18–29 year-olds: 51% of women received a positive decision compared with 41% of men.
Age: The majority of asylum applicants are adults of working age, but unaccompanied minors and children travelling with families represent a significant and particularly vulnerable subset.
- In 2024, 36,300 unaccompanied minors applied for asylum in the EU. Of these, 32% were from Syria, 16% from Afghanistan.
- In the UK, children and family groups represent a substantial proportion of those accommodated in the asylum estate (hotels, dispersal housing).
The average age of asylum seekers tends to be lower than the general population — the median applicant is typically in their mid-to-late twenties. This reflects both the demographics of conflict zones and the physical demands of irregular migration journeys.
Q11: What Is the Economic Impact of Asylum Seekers on the UK's Public Purse?
This is frequently cited as a reason for restricting asylum numbers. The reality is more complex.
Direct cost of the asylum system:
The Home Office's asylum system cost £5.4 billion in 2023/24 — a tenfold increase from £538 million in 2011/12. This is a real and significant figure. In 2024/25, costs fell for the first time since 2013, to £4.8 billion, but remain historically high.
The primary driver of this cost is not the asylum seekers themselves but the asylum backlog — approximately 175,500 people awaiting an initial decision at its peak in mid-2023. People in the backlog typically live in government-funded accommodation (including hotels), at significant cost to the public purse.
Asylum support payments:
Destitute asylum seekers are entitled to free accommodation and a weekly cash allowance under section 95 of the Immigration and Asylum Act 1999. The current rate (2026) is £49.18 per week — 35% lower in real terms than when the single rate was introduced in 2000.
Broader economic impact:
- Asylum seekers are not eligible for most mainstream benefits. They cannot access Universal Credit, and their right to work is severely restricted while their claims are pending.
- The Home Office estimated that allowing asylum seekers to work after 12 months of waiting would increase GDP and reduce net costs.
- Longer asylum waiting times have documented negative effects on long-term employment outcomes and integration (Research by Cornell et al., 2024).
Context: £4.8 billion is approximately 1.5% of total government current expenditure. It is a significant sum — but it is also the cost of a system that has been deliberately designed to process claims slowly, accommodate people in expensive hotel accommodation rather than processing them timeously, and prevent asylum seekers from working.
Q12: Why Are These Statistics So Little Known? And So Little Recognised by the Public?
There is a substantial body of research on this question, and the findings are consistent.
The media environment: UK press coverage of immigration is heavily concentrated on asylum and irregular arrivals. Studies of media content consistently show that asylum and small boats receive disproportionate coverage relative to work or study migration — which make up the overwhelming majority of immigration. A person who reads UK newspapers might reasonably believe asylum seekers are the primary form of immigration. They are, in fact, approximately 14%.
Political framing: Both Conservative and Labour governments have focused heavily on "stopping the boats" as a policy priority and a political message. This has kept the asylum issue at the forefront of public attention even as asylum numbers have fallen and overall net migration has dropped dramatically.
The statistics are not widely communicated: When net migration falls by 75%, this is not headline news. When a small boat crosses the Channel, it is. The asymmetry in what is reported versus what is not reported shapes public perceptions in a way that consistently leads to overestimation of immigration levels.
The "availability heuristic": People estimate the frequency of events by how easily examples come to mind. Dramatic, memorable events — a small boat crossing, a headline about asylum figures — are far more available to memory than abstract statistical trends. This is a well-documented feature of human cognition, not a failing of individual intelligence.
Q13: Why do a great many British People Polled Still Believe That Immigration Numbers Are Still Rising?
They don't — or rather, the more accurate figure is 56% who think immigration increased last year, when in fact it halved.
The British Future/Ipsos Immigration Attitudes Tracker (November 2025, based on fieldwork June–July 2025) found:
- 56% of the public incorrectly believed immigration had increased in the previous year, when ONS data showed it had halved
- 38% expected net migration to increase in the coming year, against a backdrop of already-falling numbers
- Only 16% correctly anticipated a decrease
- Net migration had, in fact, fallen by more than three-quarters from its post-Covid peak
This finding is not new. The same tracker has repeatedly found that public perceptions of immigration levels bear only a weak relationship to the actual figures. The 2024 tracker found similar levels of misperception.
The reasons are those set out in Q12: the asymmetry of media coverage, the political focus on immigration as a problem requiring action, and the cognitive availability of dramatic imagery (small boats, Calais) over abstract statistical trends.
The November 2025 report from British Future notes: "Falling immigration has been the best-kept secret in British politics for too long."
Q14: Why Do We Have Different Attitudes to White Immigration Than to Brown or Black Immigration?
This is the most uncomfortable question in the entire research programme, and the academic evidence on it is unambiguous.
The hierarchy of welcome:
Research consistently shows that public attitudes to immigration in the UK are structured by the perceived race, religion, and culture of the migrants in question — not by their actual economic circumstances, skills, or contributions. A substantial body of work from economists, sociologists, and political scientists establishes this.
The academic evidence:
- Dustmann and Preston (2007), "Racial and Economic Factors in Attitudes to Immigration" (UCL): Using British Social Attitudes survey data, they found that opposition to immigration was significantly higher for non-white immigrants even after controlling for economic factors such as skills, education, and labour market impact. The racial dimension was independent of the economic dimension.
- Ford (2011), "Is There Evidence of Anti-White Immigration Attitudes?" (Journal of Ethnic and Migration Studies): Found that white British respondents expressed significantly lower levels of concern about immigration from "old Commonwealth" countries (Australia, Canada, New Zealand) compared to non-white countries — even though the economic profile of immigrants from these countries is broadly similar.
- Afonso (2025), "Skills and Racial Penalties in Immigration Preferences in Britain" (preprint): Found that British respondents apply a significant racial penalty to immigration preferences — white immigrants are systematically preferred to equally-skilled non-white immigrants. The penalty is largest for Black African and South Asian immigrants.
- The same dynamic operates within Europe: Comparative European research has consistently found that public opposition to immigration is highest for immigrants from Muslim-majority countries and sub-Saharan Africa, and lowest for immigrants from historically white Christian-majority countries. This pattern holds even when controlling for education, skills, and labour market variables.
Why does this happen?
The mechanisms are complex and multiple:
- In-group bias: Humans display a universal tendency toward in-group preference. In a predominantly white British population, "white" is an in-group marker that "feels" safer, more familiar, and more compatible.
- Racialised media framing: Years of media coverage associating immigration — particularly irregular immigration and asylum — with non-white people from the Global South has created a strong associative link in public perception between "immigration" and non-whiteness.
- The "cultural distance" argument: Some respondents explicitly cite religion, culture, and "the colour of skin" as reasons for their preferences. When pressed on this, some fall back on cultural or religious difference as a more socially acceptable framing of what is essentially racial discomfort.
- Historical legacy: The UK's colonial history means that non-white immigration is particularly charged, carrying associations of empire, post-colonial migration, and the demographic transformation of British society since the 1950s.
The evidence that it is real:
Perhaps the most striking data point: the UK public, on average, significantly overestimates the proportion of immigrants who are non-white. The actual figure is roughly consistent with the overall population (approximately 14% of the UK population is from ethnic minority backgrounds). The perceived figure is substantially higher.
This overestimation is not random — it is systematically shaped by which groups are most visible in the media coverage of immigration, and those groups are overwhelmingly non-white.
Summary
The fourteen questions addressed in this paper form a coherent picture:
- Safe and legal routes exist but are numerically inadequate and narrow by nationality, relationship, employment, and geography.
- The people excluded from those routes are precisely the world's most persecuted and displaced people — the populations most in need of protection.
- The UK does not have uniquely high asylum numbers by European standards; per capita, it receives fewer asylum seekers than Cyprus, Greece, or Spain.
- People come by small boats because no other option exists for them.
- The legality of small boat crossing is contested under international versus domestic law — and the framing of illegality is a political choice.
- Net migration has fallen by more than three-quarters from its 2023 peak, to its lowest non-COVID level since 2012.
- Asylum applications have risen sharply since 2021 but the UK grant rate has fallen to 42%.
- The top nationalities by volume are Pakistan and Bangladesh; the top nationalities by desperation are Eritrea and Sudan (near-100% grant rates).
- The asylum system costs £4.8 billion annually — primarily because of deliberate policy choices to slow processing and accommodate people in expensive temporary housing.
- Public misperception of immigration levels is systematic, persistent, and driven by media and political framing — not by the statistics themselves.
- Racial attitudes to immigration are real, documented, and operate independently of economic factors. The research consistently shows that non-white immigrants face a penalty in public attitudes that white immigrants do not.
The through-line is clear: the political and media narrative about immigration in the UK is, on the key empirical questions — scale, composition, trajectory, cost, and legitimacy — systematically at odds with what the data actually shows.
Key Sources
- Home Office, Immigration System Statistics, Year Ending December 2025 (asylum, routes, costs)
- ONS, Long-Term International Migration, Provisional (net migration figures 2015–2025)
- Migration Observatory, Asylum in the UK (comprehensive briefing, updated 2026)
- Migration Observatory, The UK's Asylum Backlog
- Eurostat, Asylum Applications — Annual Statistics (EU comparisons, 2024)
- European Union Agency for Asylum (EUAA), Latest Asylum Trends 2024: Annual Analysis
- British Future / Ipsos, Noise and Nuance: What the Public Really Thinks About Immigration (Immigration Attitudes Tracker, November 2025)
- British Future, Immigration Falling But Public Still Thinks It Is Going Up (November 2025)
- All-Party Parliamentary Group on Refugees, Safe Routes Inquiry Report (February 2025)
- Dustmann, C. and Preston, I. (2007), "Racial and Economic Factors in Attitudes to Immigration," BE Journal of Economic Analysis & Policy
- Afonso, A. (2025), "Skills and Racial Penalties in Immigration Preferences in Britain," preprint
- Ford, R. (2011), "Is There Evidence of Anti-White Immigration Attitudes?" Journal of Ethnic and Migration Studies
- NatCen, British Social Attitudes 41: Immigration
- Ipsos, Public Hostility Towards Immigration: Understanding the Contradictions (May 2025)
- UNHCR, Global Trends: Forced Displacement (2024)
- Free Movement, The Sorry State of the UK Asylum System (legal analysis)
Compiled for informational and educational purposes. All statistics from official government sources, international organisations, or peer-reviewed academic research. Most recent data as of August 2026.
My thanks to SAL-9000 for doing all the research donkey work
By Bea Groves-McDaniel, 10/8/2026